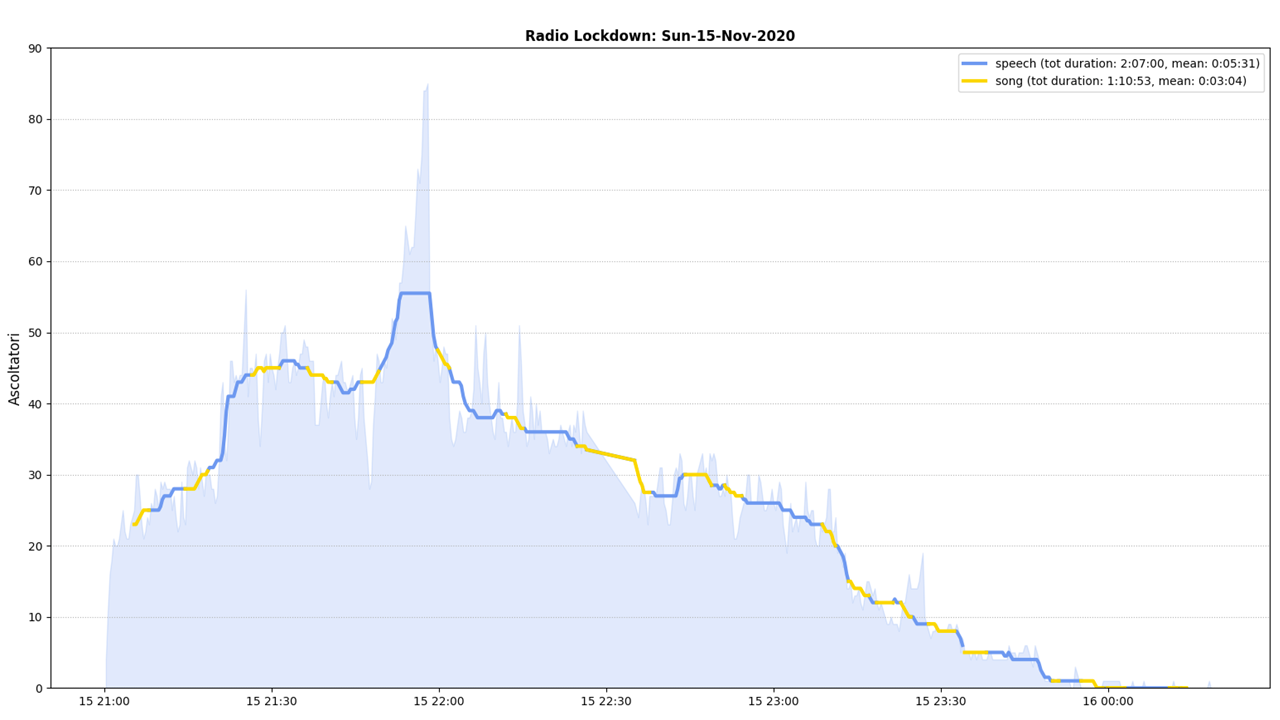
In my fun quest to quantify our performance with Radio Lockdown, I start asking myself questions such as: can we keep track and quickly summarize the topics we discussed about during the different episodes? and what if we were able to see if changes in the number of listeners could be related to the content be streamed at any given time?
To try answering these questions, I realized the first step would have been that of segmenting the recorded MP3 audio file of the episode into “speech” vs “song” intervals, and then do some analysis on those. Audio segmentation is obviously a non-trivial thing to do, and many applications use machine-learning models trained on labelled dataset. This was my biggest constraint, in that I had no adequate labelled standard dataset that I could use to train any model. Therefore I needed to find other ways.
I did I quick research, and found that in most audio-segmentation applications, machine-learning algorithms are fed with (among other things) particular types of audio features called Mel-Frequency Cepstral Coefficients (aka MFCCs), a specific representation of the power spectrum that is particularly well suited to capture discriminative characteristics of different audio sources such as music and speech, which was exactly what I was searching for!
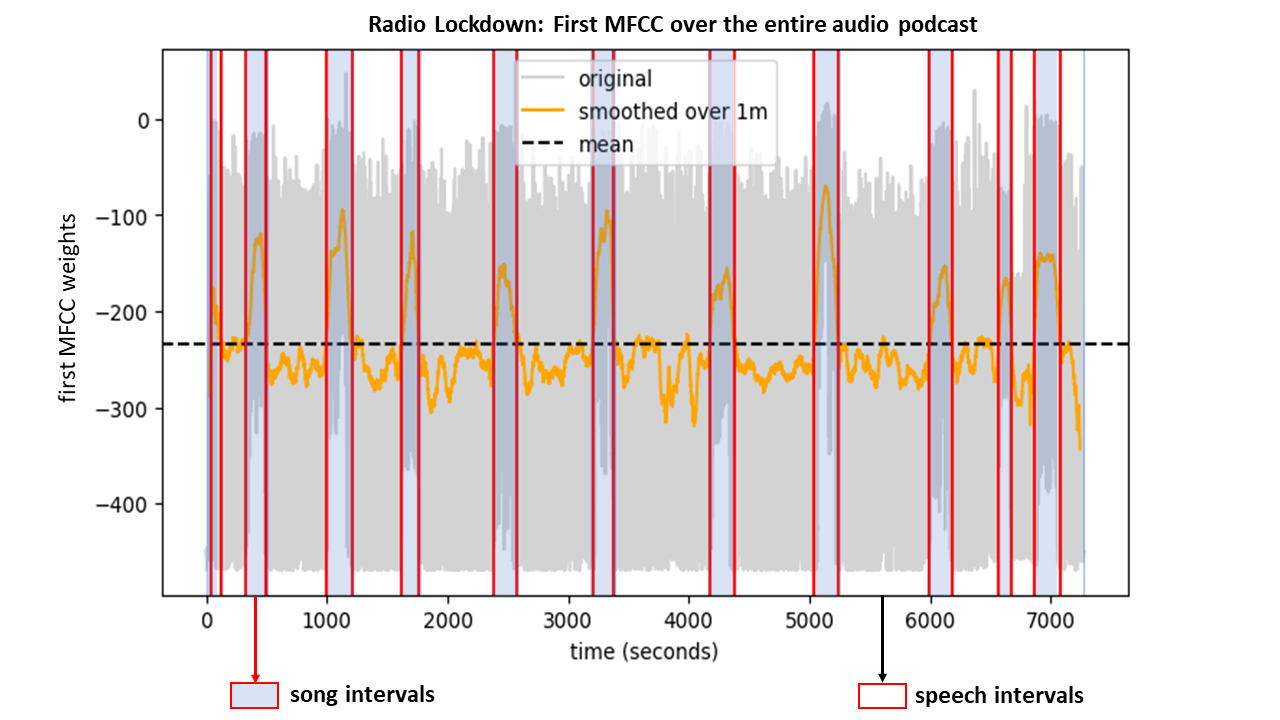
I used librosa, an amazing python library, to compute MFCCS of different audio traces of Radio Lockdown, and I quickly realized something very nice: apparently I could kind of easily distinguish speech vs no-speech (i.e. songs) intervals just by looking at the first MFCCs, discarding all the rest!
In practice, I smoothed the first MFCC using a moving average over 1 minute, and this simple procedure emphasized the very different weights of the first MFCC associated to music (highlighted in blue in the figure on top) and of speech! to distinguish between music vs. speech intervals I used a very, very, very dumb strategy: I just marked all the points where the weight crossed the mean weight, and then considered “music” the intervals having weights larger than the mean for at least one minute in a row, and “speech” the others!
This whole procedure was so simple I was surprised to realized that it was also pretty accurate in segmenting speech vs music intervals - or at least, accurate enough for it to work acceptably within our needs. Here an example of the audience tracking plot after being segmented segmented into speech (blue) and song (yellow) intervals.


