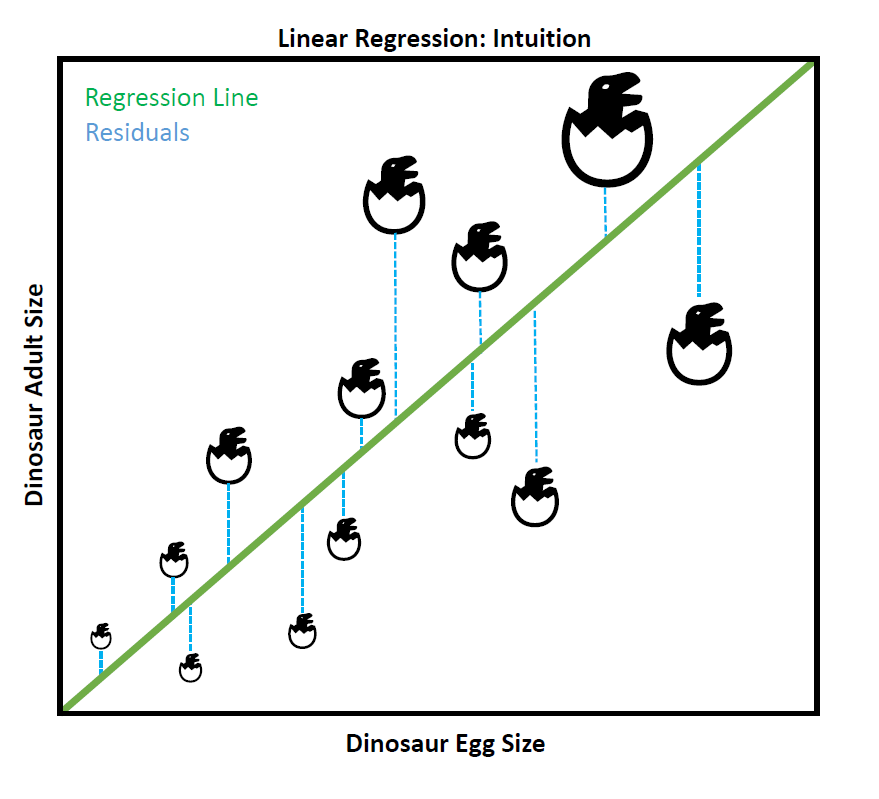
Linear Regression is one of the oldest Supervised learning method.
The idea is to fit a line to the data, and use this line to predict new target data - In case we have two input features to predict our target, we will fit a plane to the data, and if we have more than two input features, it will be a hyperplane.
To keep everything simple, let's assume we have to fit a line to the data, as we only have one input feature. The line equation is:

Where
The fitting is performed by evaluating different values for the regression coefficients
Let's make an example.
We can assume that, in general, the bigger the eggs of a dinosaur, the bigger the adult dino will be,
suggesting a possibly linear relationship.
We can therefore use Linear Regression to predict the most probable adult size of a given dinosaurs just by knowing the size of its eggs.
To find the best-fitting line that we will use to make our predictions, we will use some loss function that will minimize the residuals (i.e. the errors), in other words, the distance between every observed data point and the regression line. In the above plot, the regression line is green, whereas all the residual distances have been colored in blue.
Linear Regression with sklearn
Let's see how to perform linear regression using sklearn. For that, we will use the diabetes toy dataset, that can be imported directly from sklearn.

We will first show how to perform Simple Linear Regression by selecting only one of the input features in the dataset, and later we will perform Multiple Linear Regression bu using all of the
Simple Linear Regression


Multiple Linear Regression

As expected, using all input variables increase the performance of our prediction, as
However, increasing the number of input variable makes also our model more prone to overfitting, plus the more variable we use to predict, the less we know which variables are actually the ones more responsible for the relationship we see.
Some of the methods used to overcome those issues are Lasso, Ridge or ElasticNet Regressions which I will cover in later posts with Python hands-on examples.

