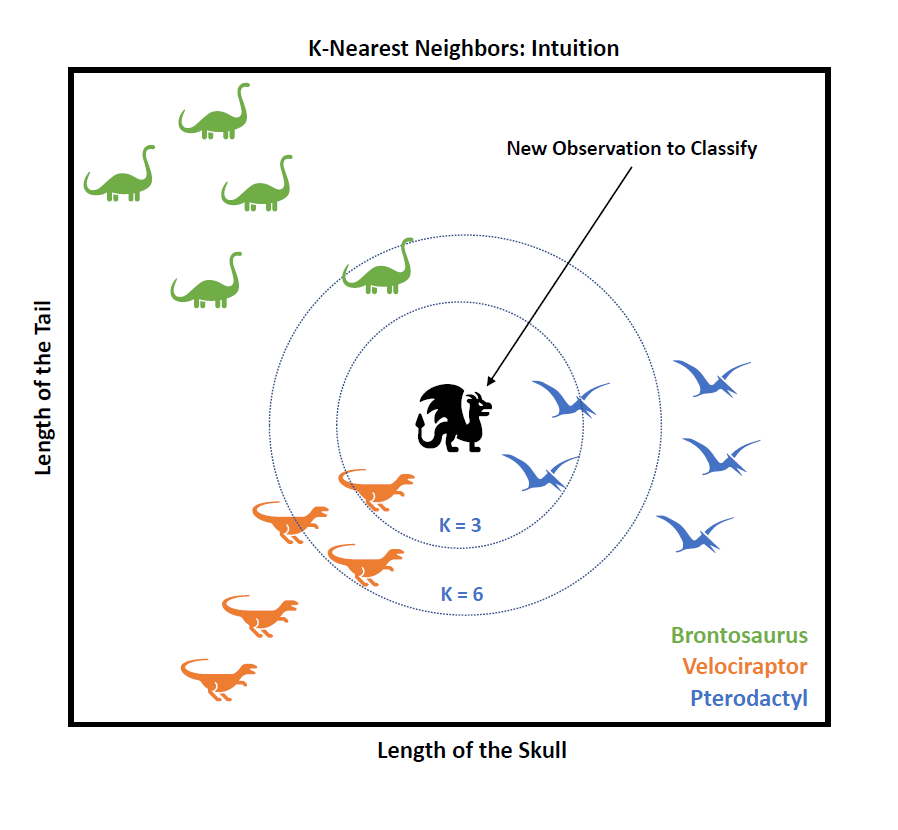
The idea is to use the already labelled k nearest-neighbors data points in the training set to predict to which category do new observations in the test set likely belong to.
In the example figure, we have the remains of three types of dinosaurs, and for each dinosaur, we have measured two features: the length of the skull and the length of the tail.
Imagine we have found some remains of a newly discovered animal (the Black Dragon), and we measure both its skull's and tail's length: can we compare them with the ones measured from the other dinosaurs to know to which already-known dinosaur does the discovered remains more likely belong to?
If we apply kNN and we choose k=3, we will assign the
new observation (the Black Dragon) to the Pterodactyl category (because 2 of
the 3 nearest observations are Pteros), whereas if we would choose k=6, it will be labelled as a Velociraptor.
The kNN algorithm is as easy as that!
KNN using sklearn
Now we'll see a practical example of how to perform kNN using sklearn on the Breast Cancer dataset, a well-known dataset to perform binary classification of cancer samples (0=Malignant vs. 1=Benign). The whole dataset consists of 569 observations, 30 features per observation.


From the confusion matrix cm (printed as an array) we can see that the trained kNN model predicts 47 True Positives, 84 True Negatives, 6 False Positives and 6 False Negatives. Therefore, we can compute the model accuracy, i.e. the proportion of correct predictions (including both True Positives and True Negatives) over all predictions:

Now we will evaluate the kNN model performance for different numbers of neighbors.


From the train-test plot, it seems that the optimal number of neighbors for this particular dataset is k~18.

