banner

Ruggero Bettinardi, PhD

Variability of Brain Structural Connectivity
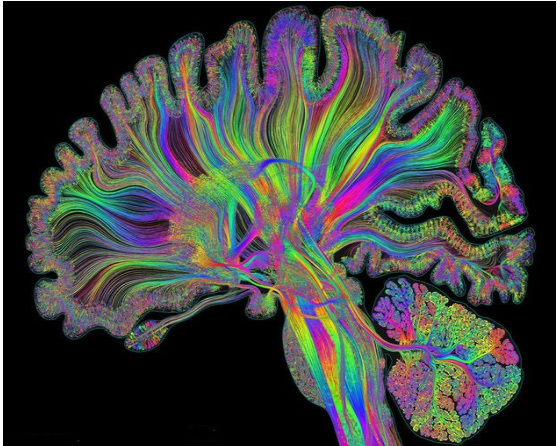
From Diffusion Tensor Imaging (DTI) it is possible to obtain an approximation of the amount of brain mid- and long-range fibers (i.e. bundles of axons) connecting different brain regions, giving rise to what is typically called the Structural Connectivity (SC) matrix (in the image above, rightest image, darker colors correspond to larger numbers of fibers connecting any two brain regions). The important information here is that, in principle, pair of brain regions connected by more fibers should communicate "more" (i.e. more frequently, and stronger) with each other than less connected regions.
thumbnail-sc-variability
However, as any other type of measurement approximation, DTI-based structural connectivity is prone to error. It is therefore important to explore how and how much the estimated SC values vary over different individuals: to this aim, I compared the SC matrices obtained from 40+ healthy subjects.
Figure5

A. the Backbone matrix shows only those connections that were detected cross all 40+ subjects. B. Matrix of the prevalence of all links. Here, prevalence is defined as the total number of subjects in which a connection between a given pair of brain regions was detected (darker colors corresponds to higher prevalence, see colorbar in panel D). C. Prevalence distribution across subjects (together with the cumulative distribution). D. This scatter plot shows how the prevalence of a link is inversely related with its weight, meaning that, as expected, "bigger" bundles of axons tend to be detected more frequently than smaller ones, and it also suggests the existence of a correlation between the strength and the length of the detected fibers, showing that in general bigger detected bundles also tend to be short, whereas long-range connections tend to be composed by smaller numbers of fibers, which in turn let them more difficult to detect, and therefore less prevalent.