Imagine we have
a quasi-stationary time series that presents some periods of times
where its statistical properties change consistently: can we spot those
intervals?
For example, imagine we have an audio recording sampling traffic sounds of a highway, and at some points we listen to the loud sound of a truck honking the horn: could we find the horn-honking segments?
There are many ways in which we could attack this problem, but here I will just show you how to do it using Hierarchical Clustering, a versatile method that we can exploit to segment a time series into self-similar windows in an unsupervised manner.
The general steps to do so we have to:
1. divide the input signal into non-overlapping windows;
2. compute some features of interest in each of those windows;
3. use the matrix storing all the features obtained from all the windows as input for the clustering: this will give you a linkage matrix;
4. plot the Dendrogram and the Scree plot;
5. To get the optimal number of clusters into which to partition the input data, we can use the “elbow criterion": looking at the scree plot, we choose the last point before maximal scree plot acceleration
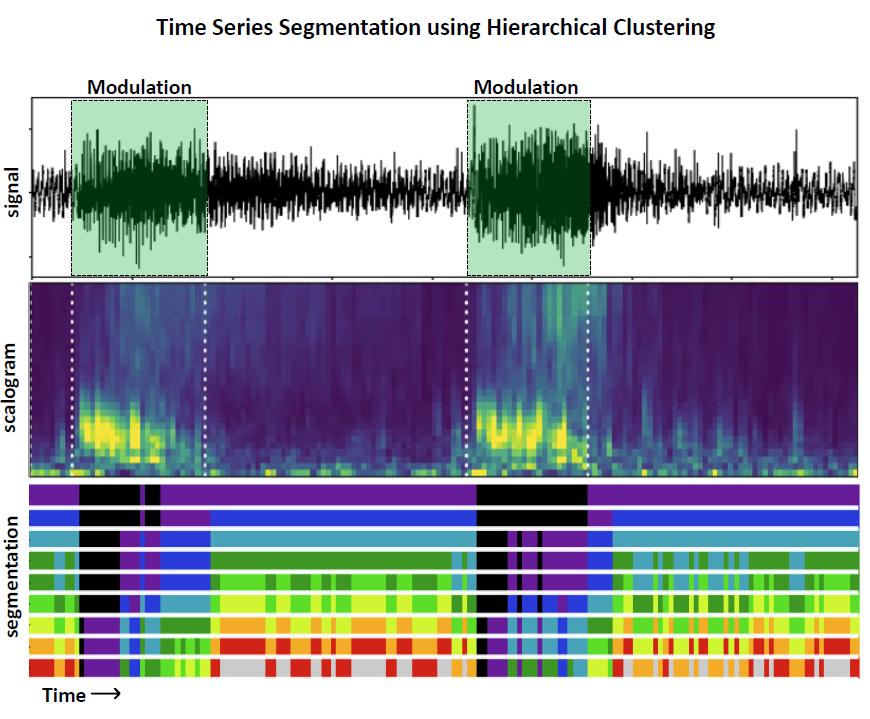
For example, I computed the scalogram (i.e. a spectrogram obtained using wavelet transform) of my audio trace, then I divided the scalogram into non-overlapping windows of 0.5 seconds and calculate the average over wavelet coefficient at each frequency within each of those windows: this was my input feature matrix X I used to perform Hierarchical Clustering.
Here below I am going to paste some Python code to perform the clustering, plot dendrogram and scree plot, and find the optimal number of clusters (which in this case we believe is 2, i.e. segments with, and without the horn-honking truck).


According to the elbow criterion, the optimal number of clusters into which to partition the input signal is indeed 2!
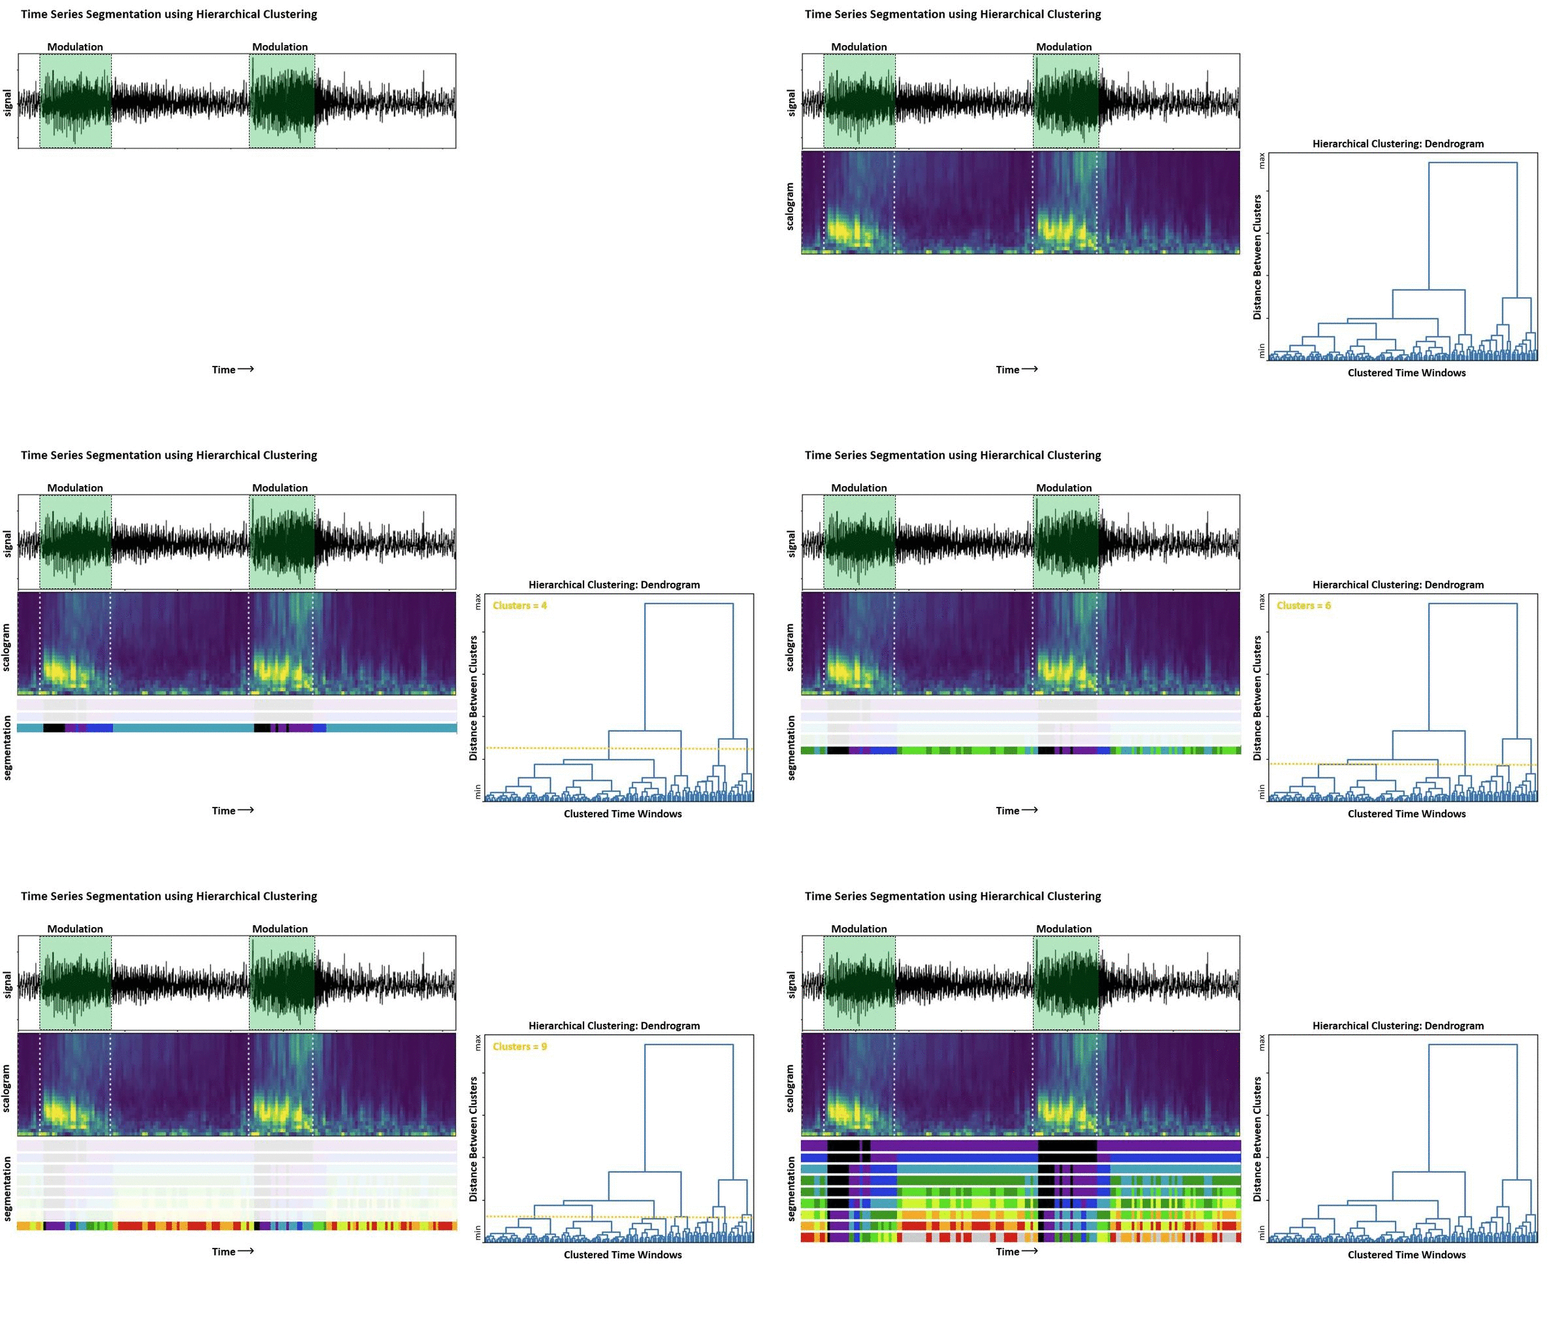
Now in the GIF below I show how changing the distance threshold at which to cut the dendrogram result in partitioning the data into different clusters.


