banner

Ruggero Bettinardi, PhD

How Anesthesia Modulates Brain Networks
Intrinsic brain activity is characterized by the presence of highly structured networks of correlated fluctuations between different regions of the brain. Such networks encompass different functions, whose properties are known to be modulated by the ongoing global brain state and are altered in several neurobiological disorders.

We induced a deep state of anesthesia in rats by means of a ketamine/medetomidine peritoneal injection, and analyzed the time course of the correlation between the brain activity in different areas while anesthesia spontaneously decreased over time.
anestesia-1
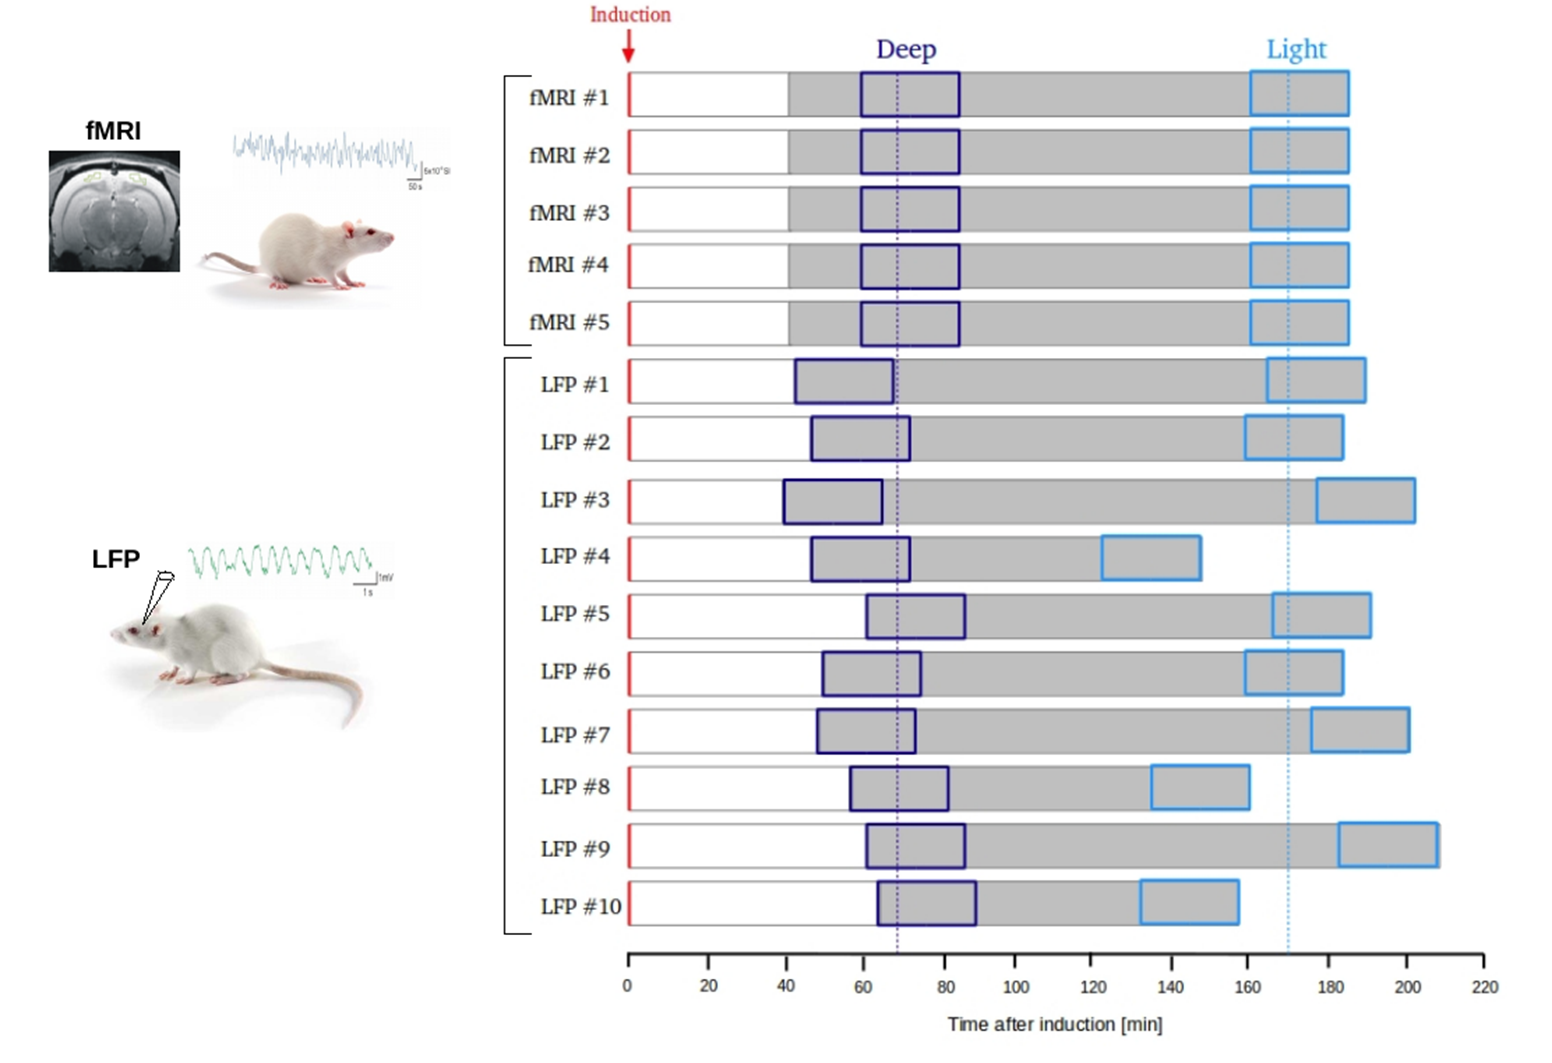
Figure 1. Experimental protocol used in fMRI and LFP experiments. The red arrow indicates the moment of anesthesia induction, whereas the recorded intervals are highlighted in gray. Dark and light blue boxes indicate the intervals used as representative of deep and light anesthesia, respectively. Overall (fMRI and LFP), deep intervals were centered at 65.4 ± 9.2 (mean ± SD) minutes, whereas light intervals were centered at 171 ± 17.7 minutes after induction, as indicated by the dark and light blue dotted lines.

We then compared results separately obtained from fMRI and local field potentials (LFP) under the same anesthesia protocol, finding that while most profound phases of anesthesia can be described by overall sparse and mainly local correlations, during lighter states different frequency-specific functional networks emerge, endowing the gradual restoration of structured large-scale activity seen during rest. 

Slide11
Figure 2. Different brain states are mirrored by different properties of the underlying functional networks. (top) Distribution of the correlation coefficients and (bottom) corresponding average FC matrices obtained from deep and light intervals. The two distributions were statistically different (*** indicates p < 0.001, Kolmogorov-Smirnov test). Dark- and light-blue triangles indicate the means of the deep and light distributions, respectively.

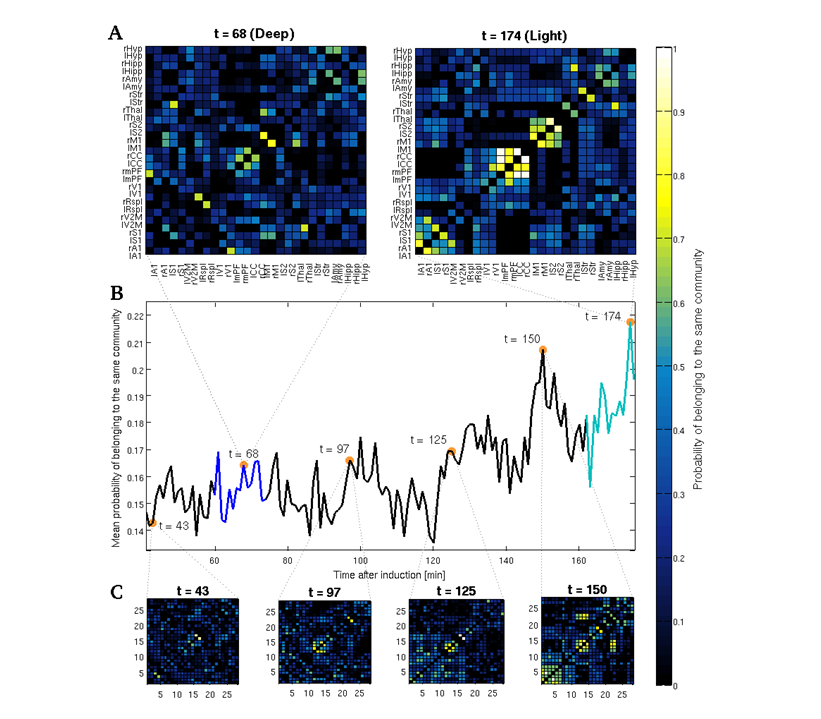
In order to capture the overall changes in communities' structure taking place during the gradual fading of anesthesia from the individual to the group level, we first iterated 10,000 times the community detection algorithm on the full (28 x 28) FC matrix obtained from each sliding window of each animal, and then computed the a posteriori probability that each pair of ROIs had of belonging to the same community across all iterations and all animals in each sliding window. We thus calculated, for each one of the obtained probability matrices, the mean a posteriori probability of belonging to the same community, in order to obtain a rather simple summary of the overall changes in the structural stability of different communities over the course of anesthesia.
Slide22
Figure 3. Functional networks' stability gradually increases while anesthesia progressively fades out. (A) Matrices of the ROIs pairwise a posteriori probability of belonging to the same functional community obtained from two sliding windows taken as representative of the deep (t = 68, left) and light (t = 174, right) anesthesia intervals. (B) Mean a posteriori probability of belonging to the same functional community over time. Superimposed dark- and light- blue lines indicate the deep and light anesthesia intervals, respectively. (C) Examples of the matrices of pairwise a posteriori probability that were used to compute the mean a posteriori probability depicted in panel B. During deeper phases of anesthesia the obtained community partitions are more variable both across iterations and animals, thus leading to sparser matrices and lower mean probabilities. Nonetheless, as the effects of anesthesia naturally decrease, BOLD fluctuations exhibit an increasing tendency to gradually stabilize in structured time-varying patterns of large-scale co-activations, as mirrored both by the increased mean probability of belonging to the same community as well as by the increasing consistency of the emerging communities. All a posteriori probabilities obtained for each sliding window were computed using all 10,000 iterations of the Louvain’s community detection algorithm over all animals.

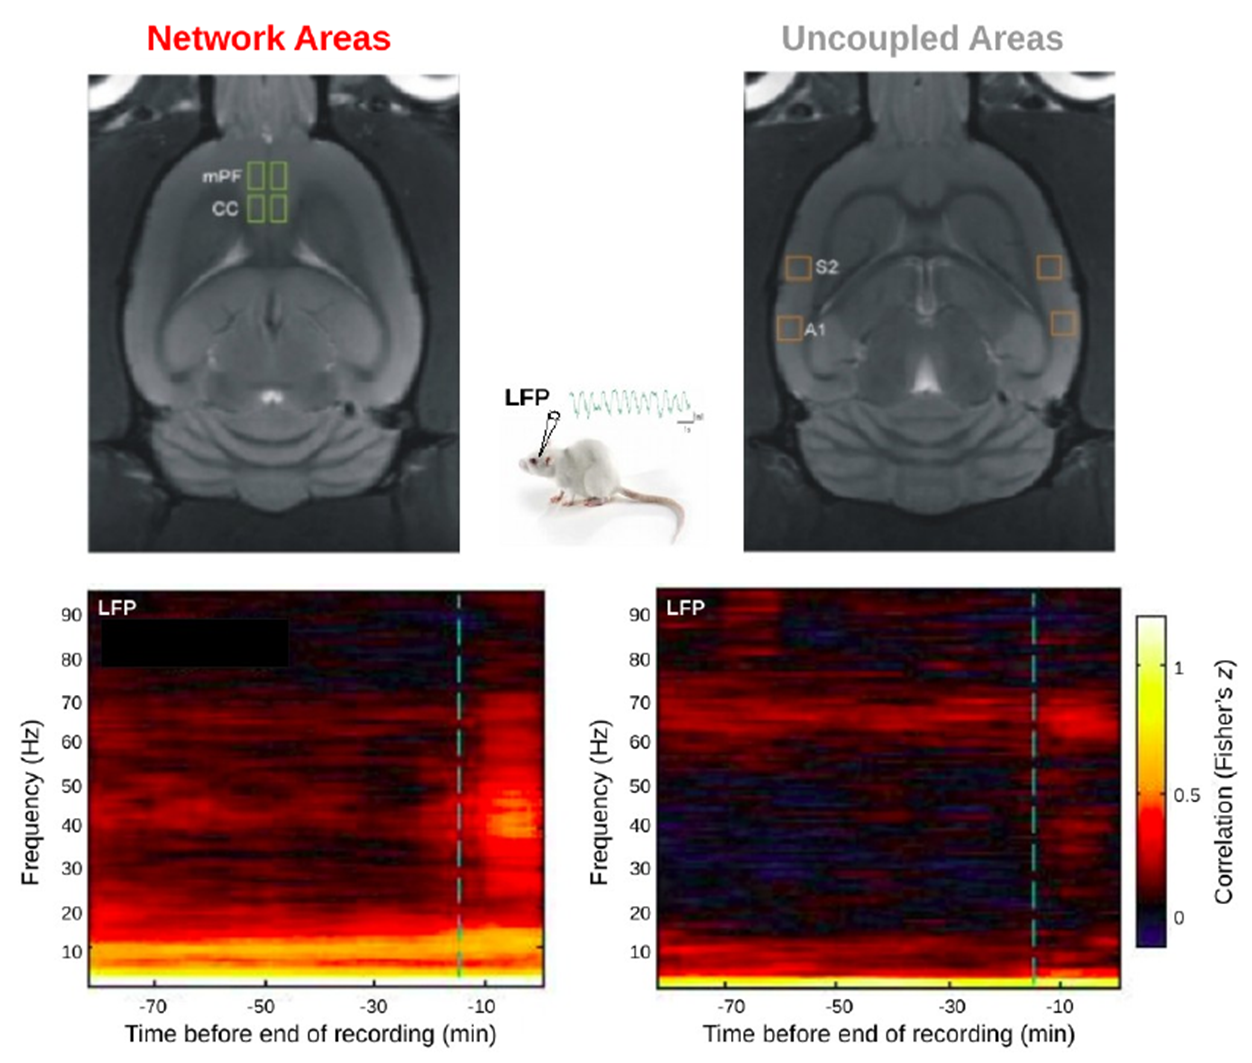
Noteworthy, the LFP results show that those areas belonging to the same functional network (which interestingly appears to be the rat’s Default-Mode Network) exhibited sustained correlated oscillations around 10 Hz throughout the protocol, suggesting the presence of a specific functional backbone that is preserved even during deeper phases of anesthesia. In order to evaluate the frequency-specific coupling between areas belonging to the same resting-state network (mPF-CC) and regions that do not (A1-S2, referred to as “uncoupled”) in deep and light anesthesia, we computed the correlation between the envelopes of homologous band-limited signals obtained from two different regions, to which we refer to as band-limited correlations (BLCs). BLCs can be seen as an extension of the classical Functional Connectivity (Friston et al. 1993) in the frequency domain and can be used to quantify the degree of co-variation between neuronal oscillations of two distant cortical regions at a given frequency (Brookes et al. 2011, Hipp et al. 2012, Cabral et al. 2014b).
anestesia-4
Figure 4. Band-Limited Correlations (BLCs) discriminate between network areas and different brain states at specific frequencies. Average BLC time courses of the two pairs of areas (see Materials and Methods). Coupled areas (top) exhibit sustained correlations around 10 Hz that are preserved during all the recording session. These average BLC time courses are shown just for visualization purposes, as they resulted from individual recordings of slightly different length (see Materials and Methods). Averages have been obtained aligning each recording to its end point and equalizing it with respect to the shortest one. This procedure does not allow to show the actual deep interval that was used for statistical comparison for each recording (see Figure 1A). For this reason, only the onset of the 15-minute light interval is shown, being represented by a light-blue dashed line.

The progressive emergence from deep anesthesia is characterized by a progressive increase in correlated large-scale low-frequency fluctuations, as well as by an enhancement in the local coupling of band-limited oscillations between areas participating to the same functional network. On the other hand, more profound phases of anesthesia are marked by a decrease in differentiated activity. Progressive fading of anesthesia is mirrored by the gradual flourishing of highly organized spontaneous brain activity, being the default-mode network one of the first networks to emerge. Nonetheless, we observed that local frequency-specific connectivity between areas participating to the same functional networks is preserved also during deeper phases of anesthesia, indicating a partial maintenance of brain functional organization even during states of deep sedation.

Related Paper: