banner

Ruggero Bettinardi, PhD

Variability of Functional Networks
We analyzed systematically the overall variability of the functional communities detected from functional connectivity (FC) networks both within and between subjects. In fact, complex networks can often be partitioned into a smaller number of sub-networks (called either modules or communities), i.e. subsets of densely interconnected nodes that are more sparsely connected to the rest of the network. Such modules can be viewed as pools of clustered elements constituting the building blocks of larger networks. Most of the community detection methods used in fMRI studies relied on the maximization of some objective function measuring the goodness of a given partition obtained from the application of the chosen community detection algorithm. To this aim we applied, to each FC matrix, a version of the canonical Louvain’s community detection algorithm based on the maximization of a modularity function for signed, weighted networks, implemented in the Brain Connectivity Toolbox.

For any FC matrix, the algorithm returns an affiliation vector, a vector of length J (being J the number of nodes in the network), where each j-th element of the vector stores the integer labeling the community to which the j-th node has been assigned. Due to the intractability to search the space of all possible partitions, community detection algorithms based on modularity maximization are stochastic, and as such the resulting community partition obtained from a given network may vary from run to run. For this reason, we ran the method M = 100 times, for each FC matrix.


In order to quantify the similarity between any two community partitions A and B, we used the normalized mutual information (NMI), a measure describing how much information one can gain about partition B given that partition A is known, and ranging from 0 (partitions A and B are independent) to 1 (A and B are identical).


Given that NMI can be difficult to interpret at first, we also used another more intuitive (but less sensitive) measure to quantify the degree of similarity between module partitions, namely the percentage of community partitions’ overlap. The communities detection algorithm found only non-overlapping communities, and therefore the minimum value for the communities overlap partition is 0.5.


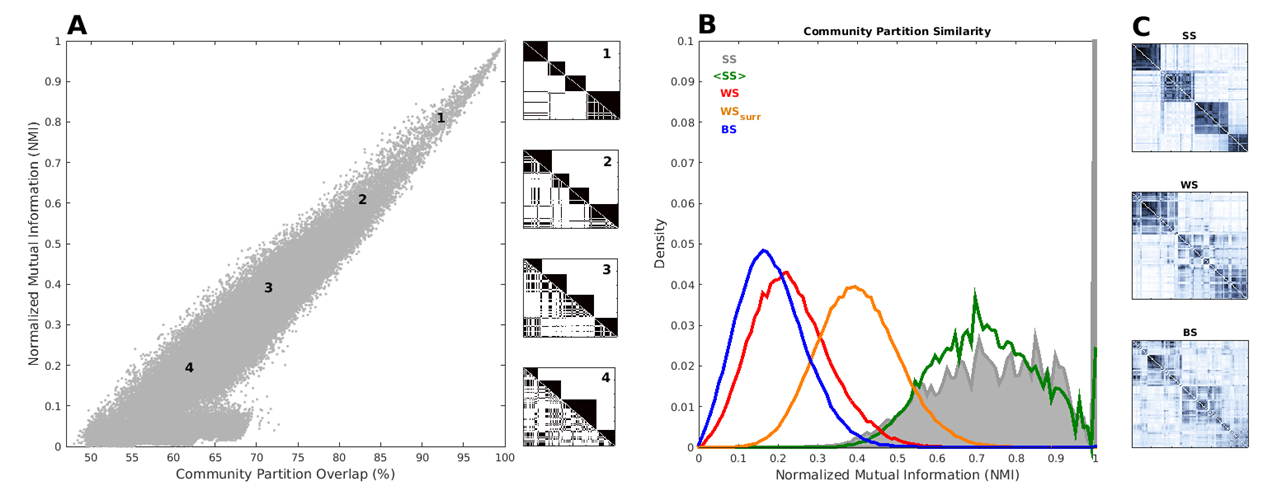
To have a graphical representation of these variables, NMI and community partitions’ overlap, in panel 1 A we presented some exemplary cases (boxes on the left).
communities
Similarity of community partitions. Panel A, the scatter plot shows the mapping between the values of NMI and the values of community partition overlap. The four small panels on its right show the comparison of two communities’ structure detected for different values of NMI. Their number refers to the squares of the scatter plot. As the connection matrices are symmetric and to help the comparison between two connection matrices, we represented only half of each in the upper and in the lower triangle. The upper and lower triangle show the two connection matrices: black if a link is present, white if it is absent. The nodes in the upper triangle are sorted to present two nodes one near to the other in case the belong to the same community. In the lower triangle we applied the same sorting of the upper triangle to see the differences in the communities. For example the box number 3 represent an NMI of approximately 0.6, and a community partition overlap of about 80%. Panel B, the histogram plot show NMI probability distributions. Blue, red and orange lines represent the similarity probability distributions between sessions between subjects (BS), within subjects (WS) and within subjects surrogates data (WSsurr ,respectively. The green line represent the distribution for the average FC obtained from the 50 sessions of each subject. Finally the gray filled distribution represent the NMI distribution for community structure found for different run of the algorithm execution, but within the same scan session.
Same Subject-Same Session (SS). Because of Louvain’s method stochasticity, we firstevaluated the robustness of this method when applied multiple times on the same FC matrix, and then compared the similarity of the resulting community partitions using NMI. The resulting distribution represents the similarity between community partitions obtained from the same session, and serves as an indication of the consistency of the community detection algorithm; as such, it can thus be viewed as the upper bound of similarity that can be expected between community structures obtained from FC of different scan sessions. We then repeated the same robustness analysis for the average FC matrix of each participant of the second data set (50 fMRI scans for six participants). The modular partitions obtained from the average FC matrix tend to be less similar than those obtained from the original individual ones (in fact, the <SS> distribution does not have a large peak in 1, as in SS). A plausible explanation for this could be that averaging individual matrices that already present some degree of community partition degeneracy themselves lead to increased degeneracy.
Within-Subject (WS). Then we analyzed the similarities between communities extracted from FC matrices within the same participant, but different scan sessions. Red line in panel A of figure 1 illustrate the distributions of similarities for this condition. The distributions for SS and W S are qualitatively different, and this is an indicator of variability in the FC matrices for different sessions. It is licit wondering whether the difference between SS and WS distributions could be caused just by the finite-sample statistical noise. To test such hypothesis, we measured NMI values for surrogate data-set generated with the method described in ??. The orange line in the same panel represent NMI distribution for surrogate data. We can see that the three distributions are all qualitatively different from one another, and that they are ordered as: WS < WS surr < SS. These results indicates that even though the finite-sample noise contribute to generate different communities’ structures, inside the FC matrices is present an intrinsic variability that cannot be explained by this statistical noise alone.
Between-Subjects (BS). Finally we calculated the distribution of NMI for the different sessions, and for different participants. In this way we are looking at the variability between subjects (blue line in figure 1B). This distribution is set to the left of WS, but the two distribution share a large overlap.
This last result demonstrates the overall low reliability of detected communities. In fact, community partitions found across different scans of the same subject tend to be slightly more similar, on average, than community partitions obtained from different subjects: nonetheless, in both cases the detected communities show a substantial variability even within subjects. This, jointly with the much more similar modular structures obtained from surrogate data suggest the possible presence of a genuine dynamic process underlying BOLD correlated fluctuations, and contributing (with the other sources of variability, see above) to the large variability in the overall detected module structures in empirical data.